Code
library(tidyverse)
library(Maaslin2)
library(png)
library(grid)
library(knitr)
library(DT)This is a Quarto document which nicely combines both R code, its results and text explanation to enable an easy and interactive access for both learners, readers and supervisors to such analyses. To learn more about Quarto see https://quarto.org. By default all code lines are blended, but you can show them by clicking on the code button.

Maaslin2 package can be used in order to automatize linear regression analysis from metagenomics data (typically 16S rRNA gene sequencing data) and most importantly include multivariate analyses in convenient manner getting very appealing graphic results as an output. For more information please visit Maaslin2 tutorial website.
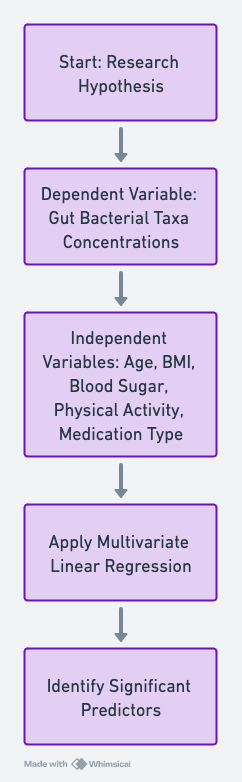
Consider a scenario where researchers are investigating the factors affecting microbiome composition among liver cirrhosis patients. The dependent variable would be the patients’ gut bacterial taxa concentrations, and independent variables might include age, BMI, blood sugar levels, physical activity, and medication type. By applying multivariate linear regression, researchers can identify which factors are statistically significant predictors of gut microbiome, thereby aiding in targeted interventions.
In this analysis we need Maaslin2, tidyverse and other minor packages.
library(tidyverse)
library(Maaslin2)
library(png)
library(grid)
library(knitr)
library(DT)Typically one needs to input files: separate microorganism abundance table (TSS normalized feature counts) and metadata indicating all factors describing independent variables and their values. In this case we have simulated mock data (made to yield some easy-to-interpret results).
bacteria <- read.table("./../input/input_bacteria.csv", header = T, sep = ",", row.names="sample")
a <- bacteria[1:6,7:8]
kable(a)| d__Bacteria.p__Campilobacterota | d__Bacteria.p__Cyanobacteria | |
|---|---|---|
| S1 | 0.0000000 | 0.0021825 |
| S2 | 0.0000000 | 0.0046416 |
| S3 | 0.0084038 | 0.0000000 |
| S4 | 0.0000000 | 0.0013665 |
| S5 | 0.0000000 | 0.0009860 |
| S6 | 0.0000000 | 0.0000000 |
metadata <- read.table("./../input/input_metadata.csv", header = T, sep = ",", row.names="sample")
b <- head(metadata)
kable(b)| Gender | BMI | Age | |
|---|---|---|---|
| S1 | Male | 39.02185 | 56 |
| S2 | Female | 26.22268 | 43 |
| S3 | Male | 31.63371 | 75 |
| S4 | Female | 20.20202 | 86 |
| S5 | Female | 24.03461 | 77 |
| S6 | Female | 29.96878 | 53 |
Maaslin2 function execution makes a big output in R console, describing model parameters and specie-by-specie calculation. You don’t need to look at this output unless something unexpected happen like an error. You might want to look at the last row to understand whether there were significant findings found.
fit_data <- Maaslin2(
  bacteria, metadata, './../output/output_Gender',
  transform = "LOG", normalization= "NONE",    # specify whether you transform and normalize data
  max_significance=0.25, min_abundance=0.000001, # specify q-value threshold and
  min_prevalence=0.4,                        # what are the cut-offs for including zero/low taxa
  fixed_effects = c('Gender'),
  reference = c("Gender","Female"),
  standardize = FALSE)
[1] "Warning: Deleting existing log file: ./../output/output_Gender/maaslin2.log"
2024-05-08 12:50:05.915512 INFO::Writing function arguments to log file
2024-05-08 12:50:05.922926 INFO::Verifying options selected are valid
2024-05-08 12:50:05.934654 INFO::Determining format of input files
2024-05-08 12:50:05.934969 INFO::Input format is data samples as rows and metadata samples as rows
2024-05-08 12:50:05.938624 INFO::Formula for fixed effects: expr ~ Gender
2024-05-08 12:50:05.939002 INFO::Filter data based on min abundance and min prevalence
2024-05-08 12:50:05.939172 INFO::Total samples in data: 50
2024-05-08 12:50:05.939344 INFO::Min samples required with min abundance for a feature not to be filtered: 20.000000
2024-05-08 12:50:05.939869 INFO::Total filtered features: 37
2024-05-08 12:50:05.940073 INFO::Filtered feature names from abundance and prevalence filtering: d__Archaea.p__Euryarchaeota, d__Bacteria.p__Acidobacteriota, d__Bacteria.p__Armatimonadota, d__Bacteria.p__Bdellovibrionota, d__Bacteria.p__Campilobacterota, d__Bacteria.p__Cyanobacteria, d__Bacteria.p__Deferribacterota, d__Bacteria.p__Deinococcota, d__Bacteria.p__Elusimicrobiota, d__Bacteria.p__Fusobacteriota, d__Bacteria.p__Gemmatimonadota, d__Bacteria.p__Myxococcota, d__Bacteria.p__Patescibacteria, d__Bacteria.p__Planctomycetota, d__Bacteria.p__Spirochaetota, d__Bacteria.p__Synergistota, d__Archaea.p__Euryarchaeota.c__Methanobacteria.o__Methanobacteriales.f__Methanobacteriaceae, d__Bacteria.p__Acidobacteriota.c__Acidobacteriae.o__Acidobacteriales.f__Acidobacteriaceae_.Subgroup_1., d__Bacteria.p__Acidobacteriota.c__Acidobacteriae.o__Bryobacterales.f__Bryobacteraceae, d__Bacteria.p__Acidobacteriota.c__Blastocatellia.o__Blastocatellales.f__Blastocatellaceae, d__Bacteria.p__Actinobacteriota.c__Actinobacteria.o__Actinomycetales.f__Actinomycetaceae, d__Bacteria.p__Actinobacteriota.c__Actinobacteria.o__Bifidobacteriales.f__Bifidobacteriaceae, d__Bacteria.p__Actinobacteriota.c__Actinobacteria.o__Corynebacteriales.f__Corynebacteriaceae, d__Bacteria.p__Actinobacteriota.c__Actinobacteria.o__Corynebacteriales.f__Nocardiaceae, d__Bacteria.p__Actinobacteriota.c__Actinobacteria.o__Frankiales.f__Nakamurellaceae, d__Bacteria.p__Actinobacteriota.c__Actinobacteria.o__Micrococcales.f__Brevibacteriaceae, d__Bacteria.p__Actinobacteriota.c__Actinobacteria.o__Micrococcales.f__Cellulomonadaceae, d__Bacteria.p__Actinobacteriota.c__Actinobacteria.o__Micrococcales.f__Intrasporangiaceae, d__Bacteria.p__Actinobacteriota.c__Actinobacteria.o__Micrococcales.f__Microbacteriaceae, d__Bacteria.p__Actinobacteriota.c__Actinobacteria.o__Micrococcales.f__Micrococcaceae, d__Bacteria.p__Actinobacteriota.c__Actinobacteria.o__Propionibacteriales.f__Propionibacteriaceae, d__Bacteria.p__Actinobacteriota.c__Coriobacteriia.o__Coriobacteriales.f__Atopobiaceae, d__Bacteria.p__Actinobacteriota.c__Coriobacteriia.o__Coriobacteriales.f__Eggerthellaceae, d__Bacteria.p__Armatimonadota.c__Fimbriimonadia.o__Fimbriimonadales.f__Fimbriimonadaceae, d__Bacteria.p__Bacteroidota.c__Bacteroidia.o__Bacteroidales.f__Dysgonomonadaceae, d__Bacteria.p__Bacteroidota.c__Bacteroidia.o__Bacteroidales.f__Paludibacteraceae, d__Bacteria.p__Bacteroidota.c__Bacteroidia.o__Bacteroidales.f__Porphyromonadaceae
2024-05-08 12:50:05.940434 INFO::Total filtered features with variance filtering: 0
2024-05-08 12:50:05.940629 INFO::Filtered feature names from variance filtering:
2024-05-08 12:50:05.940788 INFO::Running selected normalization method: NONE
2024-05-08 12:50:05.940958 INFO::Bypass z-score application to metadata
2024-05-08 12:50:05.941107 INFO::Running selected transform method: LOG
2024-05-08 12:50:05.941396 INFO::Running selected analysis method: LM
2024-05-08 12:50:05.944689 INFO::Fitting model to feature number 1, d__Bacteria.p__Actinobacteriota
2024-05-08 12:50:05.947787 INFO::Fitting model to feature number 2, d__Bacteria.p__Bacteroidota
2024-05-08 12:50:05.948549 INFO::Fitting model to feature number 3, d__Bacteria.p__Desulfobacterota
2024-05-08 12:50:05.9492 INFO::Fitting model to feature number 4, d__Bacteria.p__Firmicutes
2024-05-08 12:50:05.949835 INFO::Fitting model to feature number 5, d__Bacteria.p__Proteobacteria
2024-05-08 12:50:05.950471 INFO::Fitting model to feature number 6, d__Bacteria.p__Verrucomicrobiota
2024-05-08 12:50:05.951085 INFO::Fitting model to feature number 7, d__Bacteria.p__Actinobacteriota.c__Coriobacteriia.o__Coriobacteriales.f__Coriobacteriaceae
2024-05-08 12:50:05.951741 INFO::Fitting model to feature number 8, d__Bacteria.p__Bacteroidota.c__Bacteroidia.o__Bacteroidales.f__Bacteroidaceae
2024-05-08 12:50:05.952368 INFO::Fitting model to feature number 9, d__Bacteria.p__Bacteroidota.c__Bacteroidia.o__Bacteroidales.f__Barnesiellaceae
2024-05-08 12:50:05.953005 INFO::Fitting model to feature number 10, d__Bacteria.p__Bacteroidota.c__Bacteroidia.o__Bacteroidales.f__Marinifilaceae
2024-05-08 12:50:05.953633 INFO::Fitting model to feature number 11, d__Bacteria.p__Bacteroidota.c__Bacteroidia.o__Bacteroidales.f__Muribaculaceae
2024-05-08 12:50:05.954273 INFO::Fitting model to feature number 12, d__Bacteria.p__Bacteroidota.c__Bacteroidia.o__Bacteroidales.f__Prevotellaceae
2024-05-08 12:50:05.954902 INFO::Fitting model to feature number 13, d__Bacteria.p__Bacteroidota.c__Bacteroidia.o__Bacteroidales.f__Rikenellaceae
2024-05-08 12:50:05.958463 INFO::Counting total values for each feature
2024-05-08 12:50:05.958993 INFO::Writing filtered data to file ./../output/output_Gender/features/filtered_data.tsv
2024-05-08 12:50:05.960218 INFO::Writing filtered, normalized data to file ./../output/output_Gender/features/filtered_data_norm.tsv
2024-05-08 12:50:05.96084 INFO::Writing filtered, normalized, transformed data to file ./../output/output_Gender/features/filtered_data_norm_transformed.tsv
2024-05-08 12:50:05.961978 WARNING::Deleting existing residuals file: ./../output/output_Gender/fits/residuals.rds
2024-05-08 12:50:05.962456 INFO::Writing residuals to file ./../output/output_Gender/fits/residuals.rds
2024-05-08 12:50:05.962873 WARNING::Deleting existing fitted file: ./../output/output_Gender/fits/fitted.rds
2024-05-08 12:50:05.963129 INFO::Writing fitted values to file ./../output/output_Gender/fits/fitted.rds
2024-05-08 12:50:05.96344 INFO::Writing all results to file (ordered by increasing q-values): ./../output/output_Gender/all_results.tsv
2024-05-08 12:50:05.963884 INFO::Writing the significant results (those which are less than or equal to the threshold of 0.250000 ) to file (ordered by increasing q-values): ./../output/output_Gender/significant_results.tsv
2024-05-08 12:50:05.964161 INFO::Writing heatmap of significant results to file: ./../output/output_Gender/heatmap.pdf
[1] "There are no associations to plot!"
2024-05-08 12:50:05.964742 INFO::Writing association plots (one for each significant association) to output folder: ./../output/output_Gender
2024-05-08 12:50:05.965394 INFO::Plotting associations from most to least significant, grouped by metadata
2024-05-08 12:50:05.965586 INFO::Plotting data for metadata number 1, Gender
2024-05-08 12:50:05.979645 INFO::Creating boxplot for categorical data, Gender vs d__Bacteria.p__BacteroidotaYou can see how Maaslin2 algorithm is fitting the model to each individual taxa represented in rows.
After the output one usually goes into ouput folder to check results in Excel and pdf formats. Tables contain very detailed statistics and all ranking result. Pdf figures like the box plot below, focus on single significant hits among microbial taxa
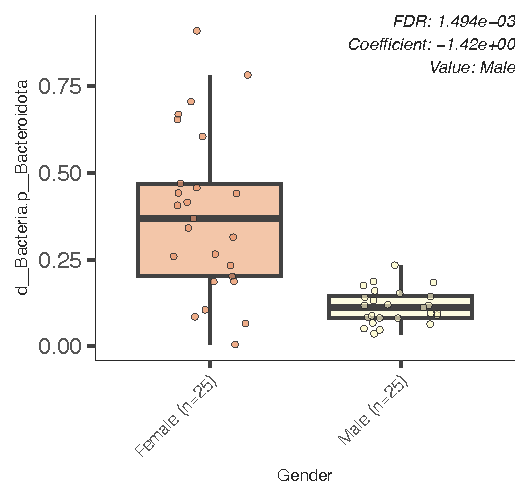
We can see here that Bacrterioidota phylum turned out to be very reduced in Male group compared to Female
We can modify our LM equation by finetuning function arguments, most importantly fixed_effects which points to the factors studied in the analysis. Here we include all three parameters: gender, age and BMI.
fit_data <- Maaslin2(
  bacteria, metadata, './../output/output_Gender_Age_BMI',
  transform = "LOG", normalization= "NONE",
  max_significance=0.25, min_abundance=0.000001,
  min_prevalence=0.4,
  fixed_effects = c('Gender', 'Age', 'BMI'),# here you add your multiple parameters as fixed eff.
  reference = c("Gender","Female"),
  standardize = FALSE)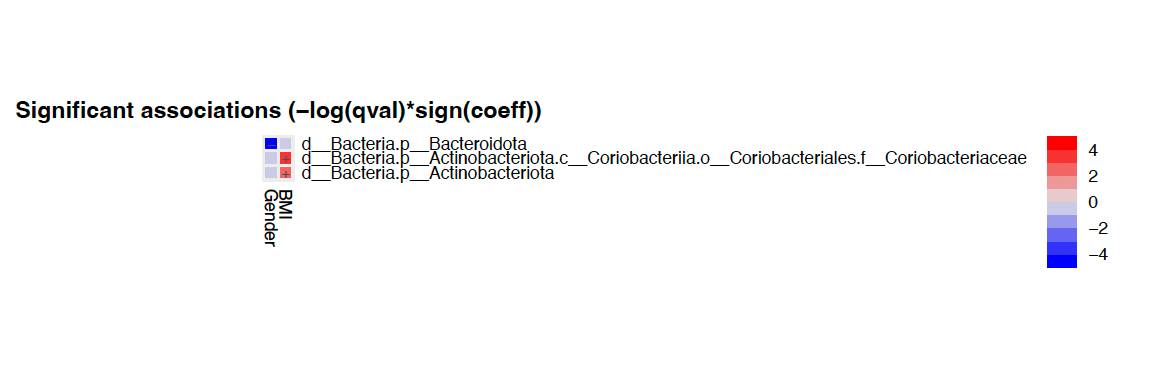
When more than one parameter is studied the results can be put out as a heatmap representing increase/decrease in the abundance of listed taxa (rows) and what parameters are statistically making the most significant contribution (columns).
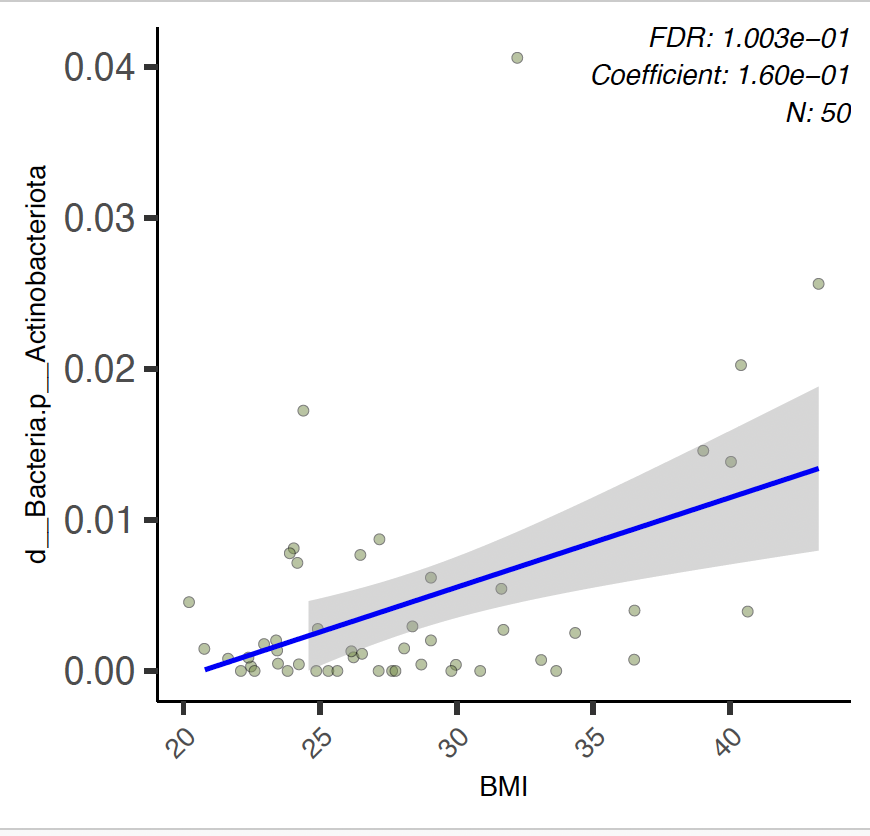
Here we see that the effect of Gender on Bacterioidota phylum remains significant, but BMI also plays high role in some taxa variablitity as indicated in BMI column of heatmap: Actinobacteriota
sessionInfo()R version 4.3.3 (2024-02-29)
Platform: aarch64-apple-darwin20 (64-bit)
Running under: macOS Sonoma 14.3
Matrix products: default
BLAS: /Library/Frameworks/R.framework/Versions/4.3-arm64/Resources/lib/libRblas.0.dylib
LAPACK: /Library/Frameworks/R.framework/Versions/4.3-arm64/Resources/lib/libRlapack.dylib; LAPACK version 3.11.0
locale:
[1] en_US.UTF-8/en_US.UTF-8/en_US.UTF-8/C/en_US.UTF-8/en_US.UTF-8
time zone: Europe/Zurich
tzcode source: internal
attached base packages:
[1] grid stats graphics grDevices utils datasets methods
[8] base
other attached packages:
[1] DT_0.33 knitr_1.45 png_0.1-8 Maaslin2_1.16.0
[5] lubridate_1.9.3 forcats_1.0.0 stringr_1.5.1 dplyr_1.1.4
[9] purrr_1.0.2 readr_2.1.5 tidyr_1.3.1 tibble_3.2.1
[13] ggplot2_3.5.0 tidyverse_2.0.0
loaded via a namespace (and not attached):
[1] gtable_0.3.4 biglm_0.9-2.1 xfun_0.43 htmlwidgets_1.6.4
[5] lattice_0.22-6 tzdb_0.4.0 vctrs_0.6.5 tools_4.3.3
[9] generics_0.1.3 parallel_4.3.3 getopt_1.20.4 fansi_1.0.6
[13] DEoptimR_1.1-3 pkgconfig_2.0.3 logging_0.10-108 Matrix_1.6-5
[17] pheatmap_1.0.12 RColorBrewer_1.1-3 lifecycle_1.0.4 compiler_4.3.3
[21] farver_2.1.1 munsell_0.5.1 htmltools_0.5.8.1 hash_2.2.6.3
[25] yaml_2.3.8 pillar_1.9.0 crayon_1.5.2 nlme_3.1-164
[29] robustbase_0.99-2 tidyselect_1.2.1 digest_0.6.35 mvtnorm_1.2-4
[33] stringi_1.8.3 labeling_0.4.3 splines_4.3.3 pcaPP_2.0-4
[37] fastmap_1.1.1 colorspace_2.1-0 cli_3.6.2 magrittr_2.0.3
[41] utf8_1.2.4 withr_3.0.0 scales_1.3.0 timechange_0.3.0
[45] rmarkdown_2.26 hms_1.1.3 pbapply_1.7-2 evaluate_0.23
[49] mgcv_1.9-1 rlang_1.1.3 glue_1.7.0 optparse_1.7.5
[53] DBI_1.2.2 rstudioapi_0.16.0 jsonlite_1.8.8 R6_2.5.1